Key points
- Only 26 out of 958 water supply systems evaluated achieved a Blue Drop certification score above 95%, according to the Department of Water and Sanitation (www.gov.za).
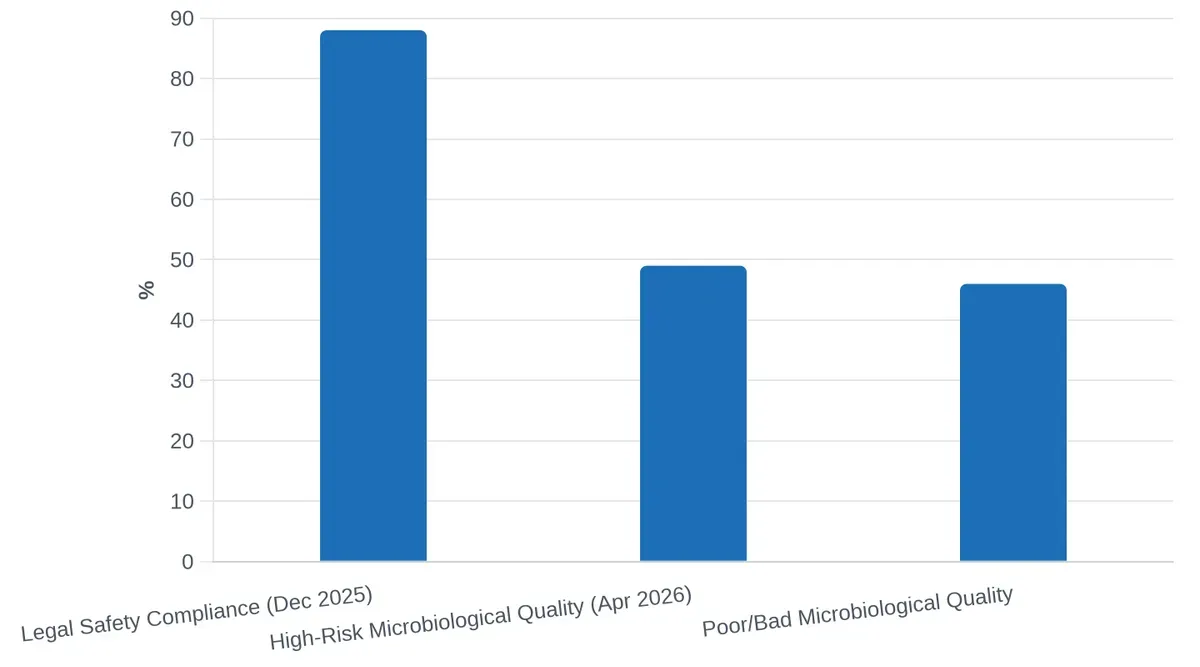
- The April 2026 Blue Drop Progress Assessment found that 49% of water supply systems carry a high-risk microbiological quality rating, linked directly to sewage spills (sahrc.org.za).
- A separate www.gov.za finding puts 46% of South Africa’s water supply systems in the “poor or bad” microbiological compliance category.
- The national infrastructure repair backlog stands at R400 billion, with 104 of 144 water services authorities rated poor or critical (engineeringnews.co.za, businesstech.co.za).
- A complete 2,500L pump and tank backup installation starts from around R16,999, while a 3-stage filtration system with UV steriliser runs R5,398 to R5,424 (reservoirsolutions.co.za, watertechs.co.za).
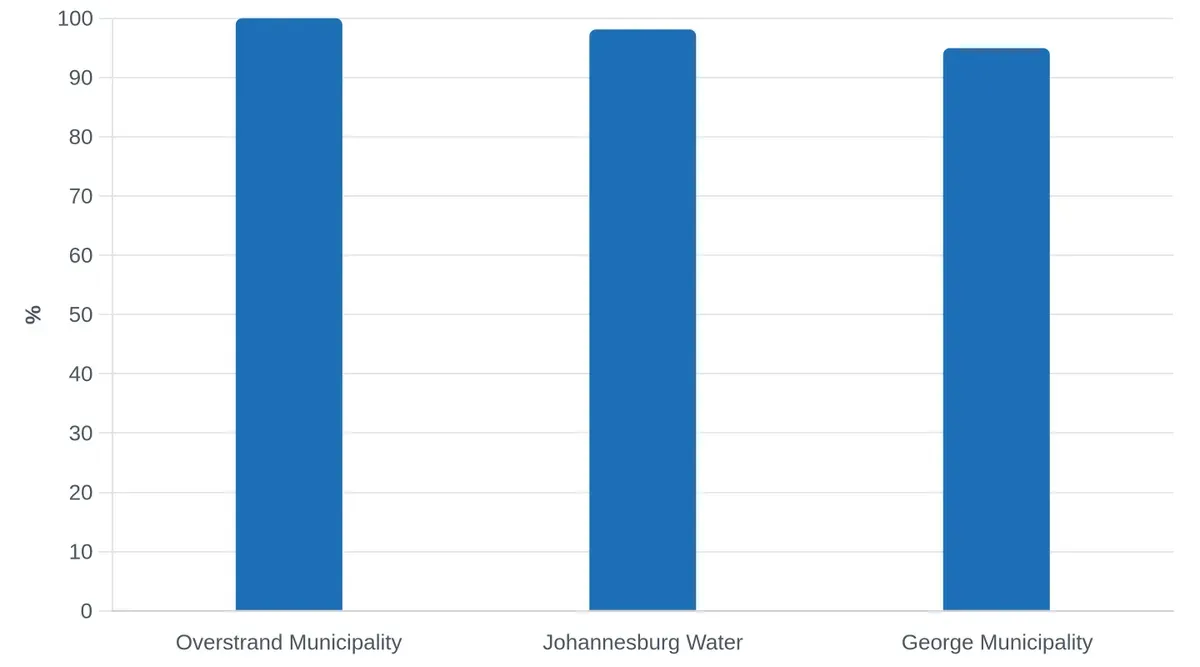
- A handful of municipalities, including Overstrand (99.99%) and Johannesburg Water (98.10%), remain genuinely high performers, and residents in those areas may need filtration rather than full backup storage.
Why the Blue Drop Report matters more than ever
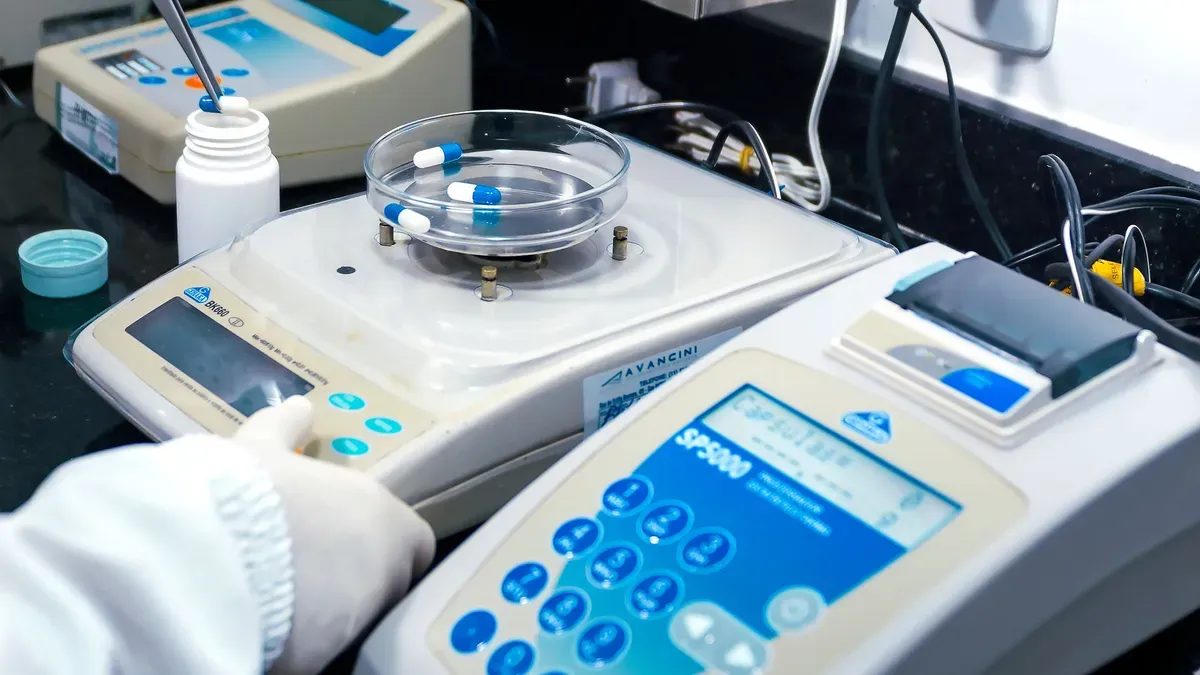
The Department of Water and Sanitation’s Blue Drop certification programme is South Africa’s most rigorous public benchmark for drinking water quality. A municipality receives Blue Drop status only if its water supply system scores above 95 out of 100 across criteria that include water quality compliance, treatment process management, asset management and consumer protection. After a long suspension the programme was reinstated, and the data it has since produced is sobering.
Of the 958 water supply systems evaluated in the 2023 Blue Drop Report, only 26 achieved that certification threshold (www.gov.za). That is a 2.7% pass rate using the standard the government itself set. Since then, matters have not improved uniformly. The April 2026 Blue Drop Progress Assessment found that 49% of water supply systems now carry a high-risk microbiological quality rating, largely because raw sewage is spilling into source water (sahrc.org.za). A complementary www.gov.za analysis puts 46% of systems in “poor or bad” microbiological compliance. Whichever figure you use, roughly half of South Africa’s supply systems cannot consistently deliver safe drinking water.
Yet the national headline hides enormous variation. Some municipalities are genuinely excellent. Others are genuinely dangerous. Understanding where yours sits is the first practical step before spending a single rand on backup or filtration equipment.
How to read your municipality’s score without being misled
Blue Drop scores are published on the DWS website and updated periodically. The score is calculated on the day of the assessment, not as a rolling average, so a municipality can score 85% in one cycle and 72% in the next if infrastructure has deteriorated. When you look up your area, keep three questions in mind.
1. What is the microbiological compliance sub-score? A municipality can post a respectable overall score while hiding a weak microbiological result, because chemical and operational compliance scores also contribute to the total. Microbiological compliance, specifically E. coli absence, is the direct human health indicator. A system that scores 90% overall but only 70% on microbiological compliance is a different risk proposition to one scoring 90% across all categories.
2. Is the score for your specific supply system or for the municipality as a whole? Large metros assess multiple systems separately. Johannesburg Water, for instance, achieved 98.10% in the most recent Blue Drop cycle (johannesburgwater.co.za). That is the aggregate for treated water leaving the plant. It does not capture what happens to that water in 2,000 km of ageing distribution pipes before it reaches your tap. Joburg Water’s own turbidity compliance fell to just 87.4% in May 2025 (citizen.co.za), meaning roughly one in eight turbidity tests that month failed the legal limit. Turbidity is important because cloudiness in treated water can indicate that the disinfection process is being compromised.
3. When was the assessment done? A score from 2023 tells you something about where a utility was two to three years ago. The infrastructure funding gap makes deterioration the more likely direction for most systems. A score that was borderline adequate in 2023 may be meaningfully worse today.
“I’ve been sick from drinking tap water in Pretoria. Was hospitalised and told by the doctor to rather not drink tap water in Gauteng. It tastes heavily of chlorine as well.”
Reddit user SpaceKriek1, on Pretoria tap water
“I’ve been noticing the quality of the tap water really taking a dip in the last couple months… I remember opening my kitchen tap, and the smell of ‘stagnant’ water filling the kitchen… took a small sip, tasted terrible as well. A few days later I started my shower in the morning… same ‘stagnant’ water smell filled the bathroom.”
Reddit user MxitWrathe, on Cape Town water
These experiences do not necessarily mean those municipalities are failing across the board. They do illustrate that a national score or even a metro-level score can diverge sharply from what a specific household experiences on a specific day.
The structural reasons scores are likely to keep falling
Understanding why scores deteriorate helps you assess whether your municipality is likely to improve or decline. The DWS Director-General, Dr. Sean Phillips, has identified three structural causes:
“Non-adherence to standard operating procedures for drinking water treatment and wastewater treatment; infrastructure in poor condition owing to lack of maintenance; and municipalities failing to hire qualified staff or prioritise budgets for maintenance and operations.”
DWS Director-General Dr. Sean Phillips
The numbers behind those causes are stark. The national government estimates the municipal water infrastructure repair backlog at R400 billion (engineeringnews.co.za). Johannesburg alone faces a R64 billion infrastructure replacement shortfall over the next decade (insidemetros.co.za). The capital cost to properly connect and upgrade a single household is estimated at R43,000 (imesa.org.za), and at the scale of the country’s servicing deficit, the arithmetic becomes impossible without sustained national funding.
The wastewater side compounds the drinking water problem directly. The 2025 Green Drop Report found that 47% of the country’s wastewater treatment systems are in a critical state (engineeringnews.co.za). When sewage treatment fails, effluent spills into rivers. Those rivers are often upstream of drinking water intakes. This is the direct mechanism linking the Green Drop crisis to the Blue Drop microbiological statistics.
“They want municipalities to fund water infrastructure with money collected from residents but many municipalities have people in poverty who can’t pay so we’re here now.”
Buyongo Phiri, responding to the DWS’s R400 billion backlog figure on Kaya 959 (February 2026)
“Where were the billions allocated to them in the national budget all these years to upgrade infrastructure going? I see another commission of enquiry loading.”
Johannes Snowy Scandley, responding to the DWS’s R400 billion backlog figure on Kaya 959
That frustration is understandable. The City of Johannesburg spent R130.5 million on water tankers in the 2024/2025 financial year (City of Johannesburg), a figure that reflects the cost of failing infrastructure rather than investing in fixing it. In Douglasdale alone, approximately 80 pipe bursts occurred in the six months leading up to August 2026 (The Citizen), leaving residents on a cycle described plainly by one of them:
“One day of water, two days no water. Next day, one day of water, two days no water, and this has been ongoing for six months.”
Peter Tucker, Douglasdale resident, at a Johannesburg Water community meeting (August 2026)
Ward 106 councillor Chris Santana confirmed the situation had reached a breaking point:
“The reason I called the meeting was that almost every day we’ve got no water in Douglasdale. We no longer report individual bursts, but are dealing with a continuous cycle of outages.”
Ward 106 councillor Chris Santana (August 2026)
Meanwhile, tariffs are rising independently of service levels. Johannesburg’s fixed water demand management levy increased by 65.6% for the 2026/2027 financial year (iol.co.za). Paying more for water that arrives less reliably and with weaker microbiological assurance is the arithmetic many households now face.
The municipalities that are genuinely getting it right
Before calculating backup costs, it is worth acknowledging that a minority of South African municipalities are delivering water that is genuinely excellent, and residents there face a different risk calculation.
Overstrand Municipality on the Western Cape coast achieved a Blue Drop score of 99.99%, the highest of any metro or local municipality in the country (overstrand.gov.za). Executive Mayor Dr. Annelie Rabie’s assessment of what that means for residents was direct:
“Overstrand residents can be assured that they are drinking the best water in the country directly from their own tap. Our team has done us proud in achieving this coveted award.”
Dr. Annelie Rabie, Overstrand Executive Mayor
George Municipality scored 94.95% and has invested R14.22 million in emergency diesel generators and R30 million in Battery Energy Storage Systems and solar PV to ensure water treatment continues through load-shedding (george.gov.za). That kind of capital commitment explains why some municipalities maintain quality while others deteriorate.
Johannesburg Water achieved 98.10% in its most recent Blue Drop score (johannesburgwater.co.za). Acting COO Jones Mnisi described the utility’s approach:
“As Johannesburg Water, we continuously strive to provide water of the highest quality… Through our testing laboratories, we pride ourselves in being the best water service authority in Gauteng, while ensuring that the water coming out of Johannesburg’s taps is clean, safe, and healthy to consume.”
Jones Mnisi, Acting Chief Operations Officer, Johannesburg Water
That claim is defensible at the treatment works level. The 98.10% score is real. What it cannot account for is ageing distribution infrastructure between the plant and your tap, which is where the turbidity compliance figures and Douglasdale pipe burst data become relevant. A high Blue Drop score and a supply reliability problem can coexist in the same metro.
Residents in areas like Hillcrest (eThekwini) and parts of Alberton often describe genuinely good water:
“I’m lucky up near the Hillcrest area [KZN] to have some of the best tasting tap water in S.A.”
A MyBroadband user on Hillcrest, KZN tap water
If your municipality scores above 95%, has a strong microbiological sub-score and has a demonstrated capital maintenance commitment, your primary concern is supply interruption rather than water safety, and a storage tank rather than filtration is the more appropriate first investment.
The real contamination risk: what 616,000 E. coli per 100ml actually means
South Africa’s drinking water standard, aligned with the World Health Organization guideline, requires zero detectable E. coli per 100ml of treated water. Buffalo City’s West Bank plant recorded 616,000 E. coli per 100ml (engineeringnews.co.za). That is not a rounding error or a borderline result. It represents water that poses a direct and serious risk of gastrointestinal disease.
Nationally, afriforum.co.za recorded that 88% of tested drinking water complied with legal safety limits on the day of testing in December 2025. That headline figure sounds reassuring until you consider what the remaining 12% represents across a population of 62 million people, and that a single day’s snapshot does not capture seasonal variation, wet-season contamination spikes, or the cumulative risk of borderline compliance over months.
Joburg Water’s E. coli compliance fell to 98.9% in March and 98.1% in April 2025 (watercan.org.za). At 98.1% compliance, roughly 1.9% of tests across the distribution system are detecting E. coli in treated water. That is not a catastrophic failure by global standards but it is not zero, and it suggests that somewhere in the network, treated water is being re-contaminated, most likely through cracked pipes drawing in groundwater contaminated by the same failing sewage infrastructure described in the Green Drop data.
A farmer near the Rooiwal plant described the downstream consequence of that contamination cycle:
“My maize cobs turned pitch black, and I lost four wheat crops when sludge stuck to the leaves and E. coli was detected.”
Theunis Vogel, grain farmer near the Rooiwal plant (December 2025)
For urban households, the risk is less visible but structurally similar: water that passes treatment in acceptable condition and then travels through deteriorating pipe infrastructure before reaching your kitchen tap.
Matching your risk profile to the right solution
Not every household needs the same response. The table below maps the most common risk profiles to the appropriate solution tier.
| Risk profile | Typical municipality type | Primary concern | Recommended solution | Indicative cost |
|---|---|---|---|---|
| Low risk, high reliability | Overstrand, George, parts of Cape Town | Taste or peace of mind | Under-sink carbon filter | R800 to R2,500 installed |
| Medium risk, microbiological borderline | Johannesburg Water, eThekwini better areas | Periodic E. coli exceedance, turbidity spikes | 3-stage Big Blue 20-inch filter plus 55W UV steriliser | R5,398 to R5,424 (watertechs.co.za) |
| High risk, frequent outages | Tshwane outer areas, Buffalo City, most Category D municipalities | Supply interruption and contamination together | 2,500L tank plus pump plus UV filtration | From R16,999 (reservoirsolutions.co.za) plus filtration |
| Very high risk or rural | 104 poor/critical systems (businesstech.co.za) | No reliable municipal supply | Rainwater harvesting plus multi-stage filtration and UV | Approximately R1 per litre of storage capacity plus R2,000 pump plus R3,500 to R4,500 filtration |
Is your municipality’s water safety a real risk?
Cost of ownership: backup system versus the ongoing cost of doing nothing
The cost-of-ownership comparison requires you to put real numbers against three scenarios: buying bottled water, installing filtration only, and installing a full storage-plus-filtration system.
Bottled water baseline. A family of four drinking 2L each per day consumes roughly 8L of bottled water daily, or around 2,920L per year. At a conservative retail price of R8 per litre for 5L bottles, that is approximately R23,360 per year, every year, with no asset value and no protection against supply interruptions.
Filtration only (medium-risk household). A 3-stage Big Blue 20-inch system with a 55W UV steriliser costs R5,398 to R5,424 (watertechs.co.za). Replacement UV lamps and filter cartridges add ongoing cost: one MyBroadband user noted that a UV filter unit cost around R1,800 at installation, with replacement lamps at R450 each. Assuming annual lamp replacement and two cartridge changes per year at roughly R300 per set, ongoing cost sits at approximately R1,050 per year. The system pays for itself against bottled water within three to four months and continues saving money every year thereafter.
One MyBroadband user described how visible the difference is when you filter municipal water:
“The last time I collected my wife and child from hospital I immediately went and bought a water filtration system… you can clearly see on the filter what the quality of the water is. In Kimberley [Northern Cape] our filter turned green and brown within a week, but here in Potch [North West] the filter stays clean (white) for a very, very long time. We rarely have to clean the filter out.”
A MyBroadband user, comparing water quality between Kimberley and Potchefstroom
Full storage plus filtration (high-risk or outage-prone household). A complete 2,500L pump and tank installation starts at R16,999 (reservoirsolutions.co.za). Add a filtration and UV system at R5,400 and the all-in capital cost is approximately R22,400. Spread over five years with R1,050 annual running costs, the total five-year cost of ownership is around R27,650, against R116,800 in bottled water for the same period. That is a saving of over R89,000 across five years, alongside the operational benefit of never running dry during an outage.
Residents who have made this investment consistently report it as one of the better household decisions they made:
“RAINWATER TANKS – The best thing we did when we built our house 10 years ago was to install a separate 2000L stainless steel tank that only goes to one tap in the kitchen, that is only used for drinking and cooking (and has a filter).”
Facebook user Michelle E., on plumbing rainwater directly to the kitchen
For those who incorporate rainwater harvesting, the economics shift further. One MyBroadband user estimated rainwater harvesting storage costs at roughly R1 per litre of capacity, with a pump adding around R2,000 and connectors and valves another R1,000 to R1,500. A 5,000L harvesting system with pump and basic filtration can therefore be installed for around R8,500 to R10,500 in materials, with the tank cost being the dominant variable depending on material choice.
The other cost of doing nothing that rarely appears in household budgets is the rising tariff trajectory. Johannesburg’s fixed water demand management levy increased 65.6% for 2026/2027 (iol.co.za). South African electricity tariffs rose 1,172% between 2007 and 2026 (poweroptimal.com). Water tariff trajectories are not following the same path yet, but the pressure from a R400 billion maintenance backlog and an ageing asset base makes sustained real tariff increases the more probable outcome. A backup system is partially a hedge against that trajectory as well.
The municipalities where the risk is already material
Buffalo City’s 616,000 E. coli per 100ml reading (engineeringnews.co.za) is the most extreme documented case, but it is not an outlier in terms of category. With 104 of 144 water services authorities rated poor or critical (businesstech.co.za), the majority of South African municipalities are managing water infrastructure under conditions that make contamination events probable rather than merely possible.
The Eastern Cape provides a concentrated example of what poor scores feel like at the household level:
“Not unless I want a colon cleanse… As it works its way into the town’s reservoir and our taps, it picks up disturbing levels of E. coli along the way (according to the water tests the local shop/butchery had to get done every week). Our digestive health has vastly improved since we stopped drinking the tap water, which also tastes like something no rational person would ever drink.”
Reddit user doodlebagsmother, on Eastern Cape tap water
The Tshwane municipality has had to write off R600 million in water-related debt for Hammanskraal residents (Tshwane Executive Mayor Press Statement), a community that suffered a cholera outbreak directly linked to compromised water quality. Debt write-offs do not repair the infrastructure that caused the problem.
A practical checklist before you buy anything
Before selecting a product, work through these steps in order. They take about 30 minutes and they will save you from buying the wrong solution.
- Find your municipality’s most recent Blue Drop score and microbiological sub-score on the DWS website or via the Blue Drop app. Note whether the score is for your specific supply system or a broader municipal aggregate.
- Check whether your area has a history of supply interruptions. Your local ward councillor’s social media page, community Facebook groups and the municipality’s WhatsApp notification system are the fastest sources. A municipality with good water quality but frequent pipe bursts still warrants storage capacity.
- Test your tap water. A basic microbiological and chemical test kit from a laboratory accredited by the South African National Accreditation System (SANAS) costs R500 to R1,500 and gives you a point-in-time reading for your specific address, not your municipality’s average.
- Match the solution to the risk. Use the table above as a starting guide. Filtration alone addresses contamination. Storage addresses interruption. Most high-risk households need both.
- Get at least two installation quotes and verify that the installer uses SANS 10252-compliant plumbing for any connection to the municipal supply, to avoid cross-contamination and to protect your warranty and insurance position.
The honest conclusion from the Blue Drop data is that South Africa’s water sector is bifurcating. A small number of municipalities are maintaining or improving quality. The majority are managing a slow deterioration driven by a funding and governance deficit that a R400 billion backlog number only partially captures. For households in the latter category, a backup water solution is no longer a luxury purchase. It is risk management, and the cost-of-ownership numbers show it pays for itself quickly.
For a detailed breakdown of which system suits your specific risk profile, municipality and budget, read the full guide on the WaterPoints South Africa advice centre.
Get started
Is your municipality’s water safety a real risk?
Vetted local installers · honest advice first
Photo: https://kaboompics.com/ / Pexels